🚨 Mid-Atlantic Region — August 2003 — Nuclear Scram Cascade
A Software Bug Triggered a Nuclear Plant Scram. 55 Million People Lost Power. Some Waited Days.
On August 14, 2003, a software bug in an alarm system at a FirstEnergy control center in Ohio prevented operators from seeing a developing problem in their transmission system. Transmission lines sagged into trees in high summer heat and failed. A nuclear plant in Michigan experienced an automatic shutdown — a scram — in response to the grid disturbance. The cascade of failures that followed blacked out the northeastern United States and parts of Canada in a matter of minutes.
55 million people lost power. Some customers in New York City, Ohio, and Michigan waited two to four days for restoration. The outage affected 21 nuclear power plants, which shut down automatically to protect themselves from grid instability — removing nearly 25,000 megawatts of generation capacity simultaneously and making restoration dramatically more complex.
Among the 55 million affected were hundreds of thousands of elderly residents, many in summer heat without air conditioning, many on medical equipment that stopped without warning. The New York City medical examiner’s office reported elevated deaths during the outage period. Hospitals operated on backup generators. Dialysis centers scrambled to continue treatments. The generation loss at one nuclear plant, combined with a software bug, cascaded into one of the largest blackouts in North American history.
⚠️ The 2003 blackout lesson: The cascade began with a tree touching a power line and a software bug preventing operators from seeing the problem. Within minutes, it had spread across eight US states and two Canadian provinces. The speed and scale of grid cascade failures means that by the time the first news alert appears on your phone, your power may already be gone — and it may not be coming back for days.
What Is a Nuclear Scram and Why Does It Matter?
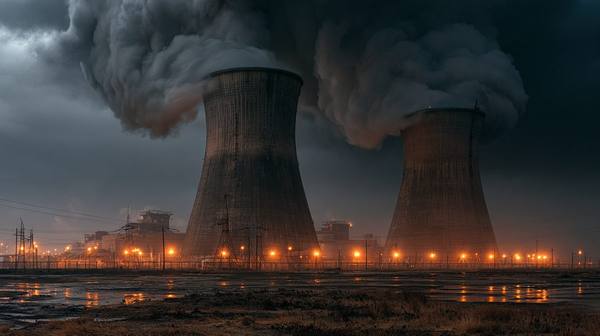
A nuclear reactor “scram” or “reactor trip” is an automatic emergency shutdown triggered when the reactor’s control systems detect a condition that requires immediate power reduction. Scrams are safety features — they work as designed and prevent dangerous reactor conditions. But they have a significant grid consequence: a 1,000 to 1,500 megawatt generator instantly stops producing power.
The grid must absorb this sudden loss from other generation sources. Normally, the grid has enough reserve capacity to handle a single generator loss without customer impact. But during peak demand periods — extreme heat or cold, when generation is already strained — the sudden loss of a major generator can cause frequency drops that trigger cascading protective actions across the interconnected system.
The NRC (Nuclear Regulatory Commission) reports that US nuclear reactors experience an average of 1 to 2 unplanned shutdowns per year. With 93 operating reactors in the US, this means roughly 100 to 190 unplanned nuclear shutdowns per year — each one removing 900 to 1,500 megawatts of generation from the grid instantaneously. Most are absorbed without customer impact. During stressed grid conditions, they are not.
Natural Gas Pipeline Failures: The Hidden Vulnerability
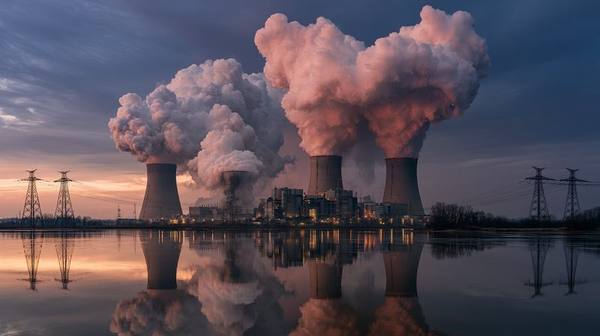
Natural gas-fired power plants generate approximately 40 percent of US electricity. They depend on continuous, uninterrupted gas supply through pipelines. When those pipelines fail — through freezing in winter cold, mechanical failure, or forced shutdown due to leaks or damage — the plants cannot generate electricity regardless of their physical condition.
Pipeline failures can affect entire regions of gas-fired generation simultaneously. A major pipeline rupture, a compressor station failure, or a system-wide freeze event can reduce gas supply to multiple plants across a region at once, removing tens of thousands of megawatts of generation capacity in a matter of hours. The grid stress that follows can trigger rolling blackouts across entire states.
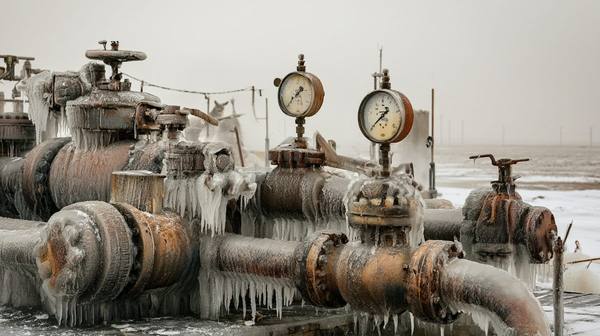
Texas 2021: When Gas Pipelines Froze and 4.5 Million Lost Power

The 2021 Texas ice storm is most commonly discussed as a rolling blackout event. But the root cause was the failure of natural gas supply infrastructure. When temperatures dropped below zero across Texas, natural gas wellheads froze. Gathering lines froze. Compressor stations — which maintain pipeline pressure — failed because their controls and sensing equipment were not designed for subzero temperatures. The gas supply to gas-fired power plants dropped by approximately 30,000 megawatts worth of generation capacity.
Texas generates approximately 45 percent of its electricity from natural gas. Losing 30 percent of that supply during the period of highest demand in the state’s history created a supply gap that the grid could not bridge. ERCOT began rolling blackouts that stopped rolling within hours. The gas supply disruption lasted four days — and so did the blackouts.
The root cause of 246 deaths and $195 billion in damage was frozen gas pipelines, not frozen wind turbines. The wind turbines received more media attention, but the gas supply failure was the primary driver of the generation shortage that killed people.
The 50–70 Math: You Cannot Predict Which Plant Shuts Down Next
Nuclear scrams happen without weather. Gas pipeline failures happen without warning. The generation loss that results can cascade through a grid that was operating normally seconds before the event. The 55 million people who lost power on August 14, 2003 did not receive advance notice. The outage that followed lasted days for some of them.
For a 71-year-old with home medical equipment in August heat, four days without power is not the same problem it is for a 45-year-old. The senior on oxygen or insulin does not have the luxury of “waiting it out.” The medical equipment does not wait. The medications do not wait. The heat does not wait.
The generator that starts automatically within 11 seconds of any power loss — regardless of whether it was a squirrel, a nuclear scram, or a frozen gas pipeline — is the only solution that addresses every category of outage in every condition. You cannot know which plant will fail next. You can know whether your home can sustain you regardless of which one does.